This console is designed for development and fine-tuning environments.
Accessing the Console
To access it:- Open the assistant from Devic’s sidebar.
- Navigate to the Conversations tab.
- Select an existing conversation or create a new one.

Main Interface
The console provides a complete view of the conversation and all events generated during it.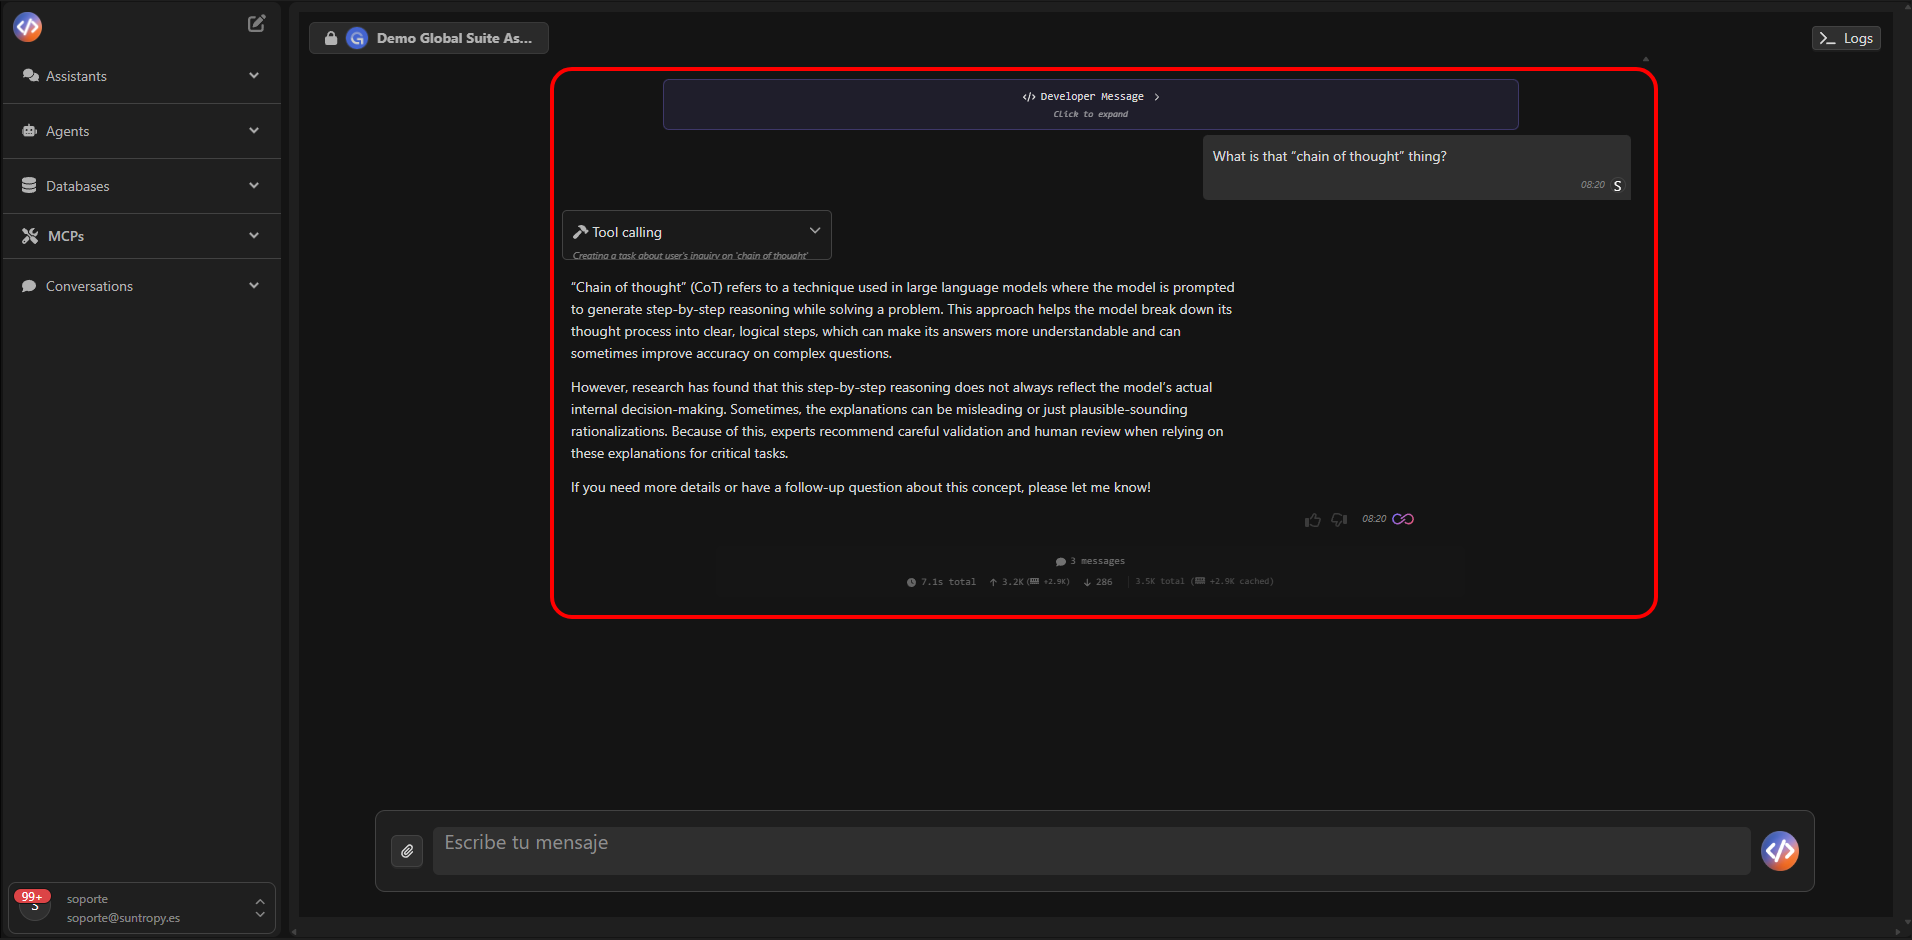
- Send test messages to the assistant.
- Observe how it responds and which tools it uses.
- Analyze the model’s internal processes in detail.
- Access the Chat Log to see system events.
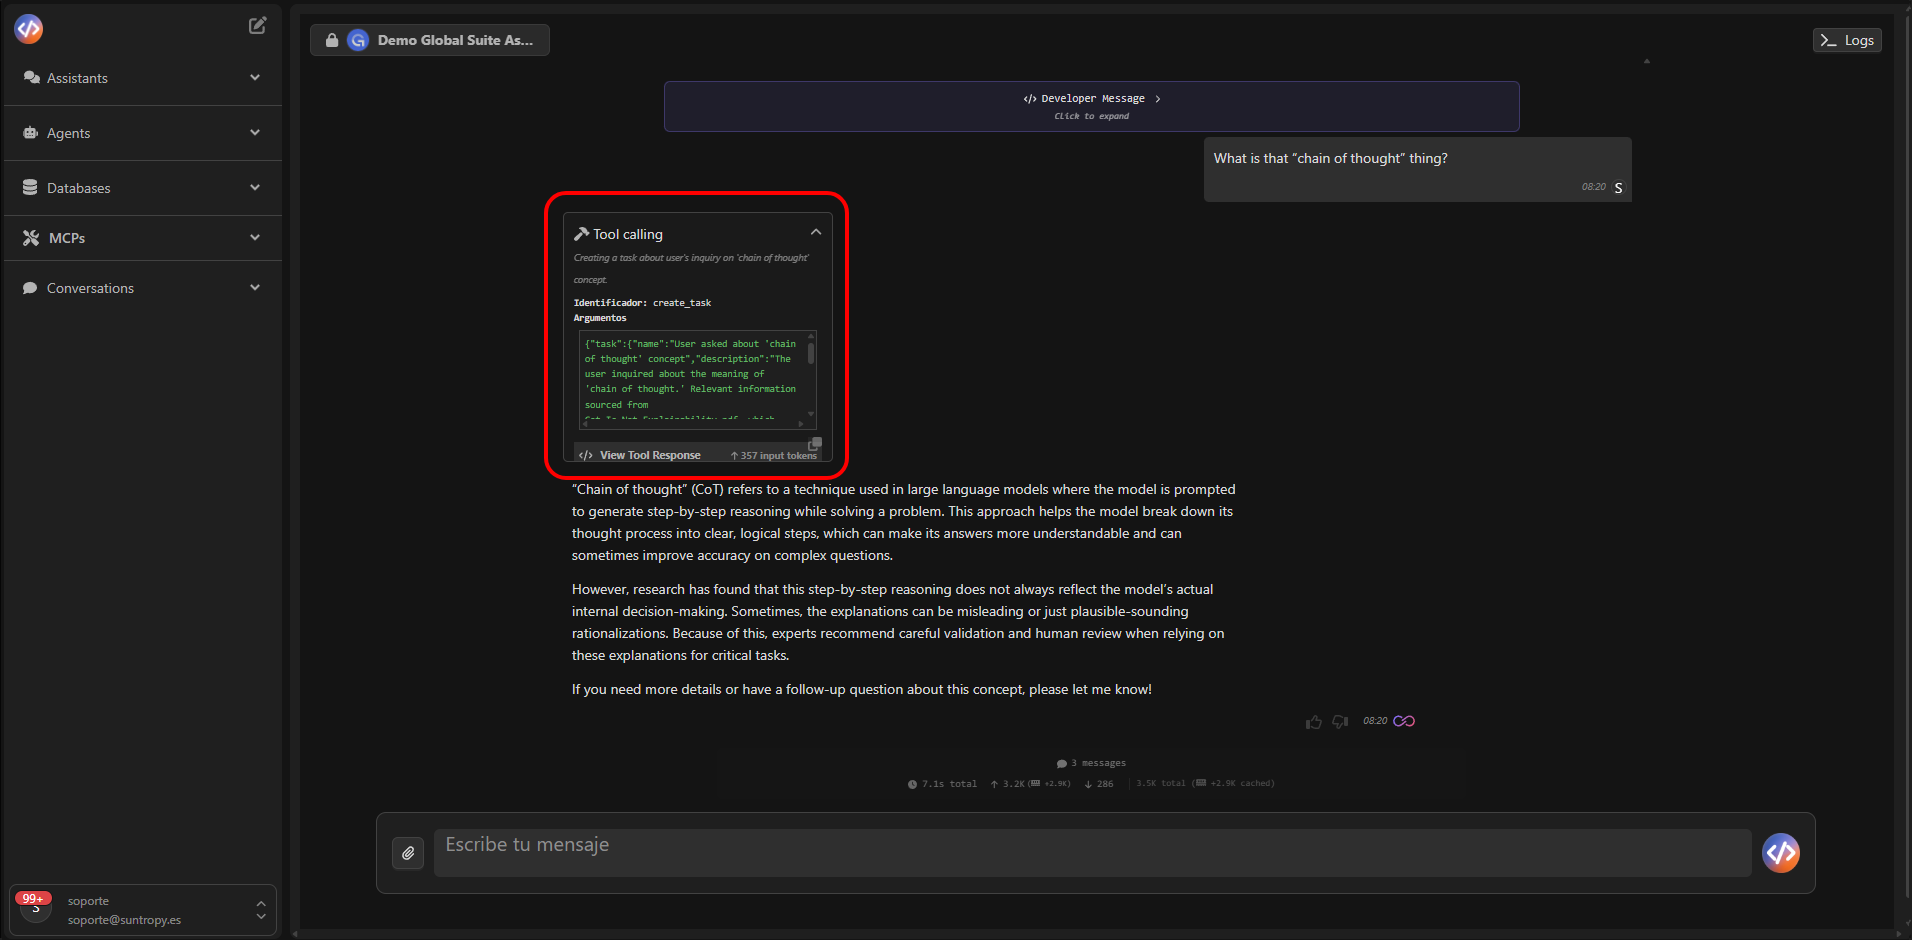
Tool Calls
When the assistant performs an action (for example, querying a database, performing a web search, or sending an email), Devic displays it through a Tool Call Card.These cards show which tool was invoked, with what arguments, and what the response was.
Logs and Debugging
The Logs tab provides a detailed view of all events recorded during the conversation, including model API calls, tool calls, partial responses, and errors.
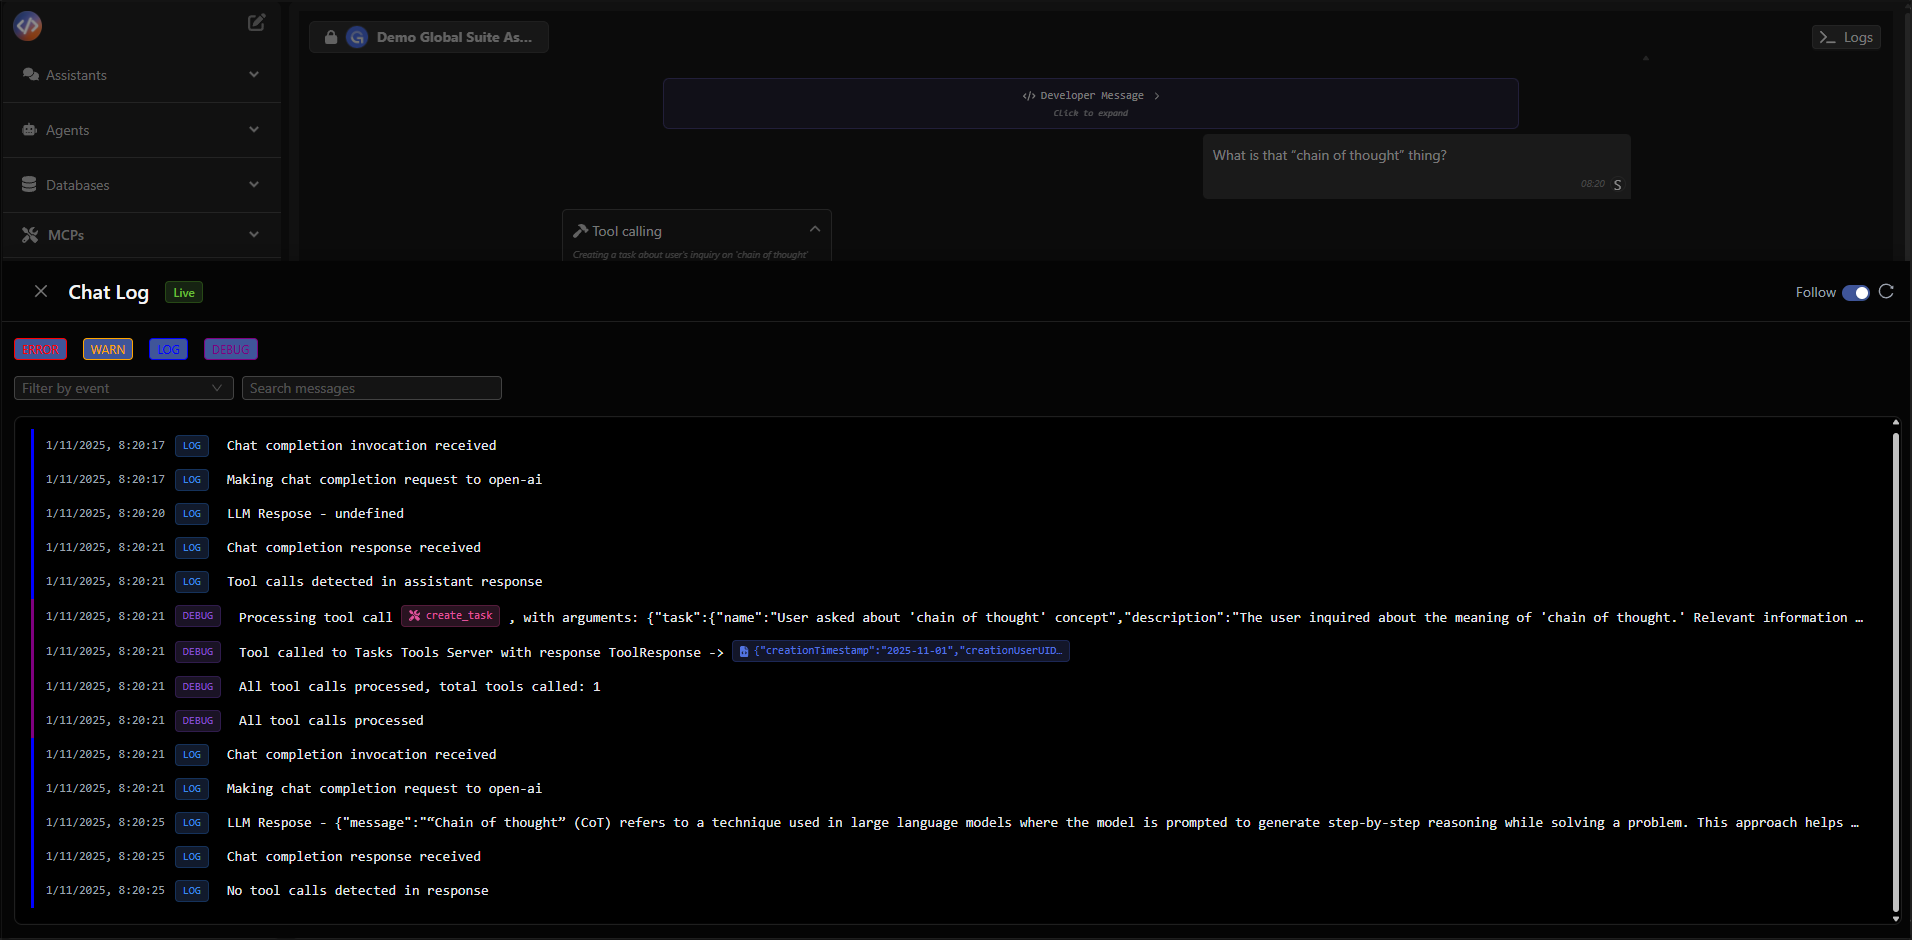
- Filter by event type (
LOG,WARN,ERROR,DEBUG). - Follow the chronological order of execution.
- Analyze response times, internal messages, and processed content.
- View the exact parameters of each tool call.
- Why a tool didn’t return the expected result.
- Whether the assistant is correctly interpreting the prompt.
- When the LLM intervenes and when an external tool is used.
Message Analysis
You can inspect every message exchanged (both from the user and the assistant) to review its full JSON structure, including inputs, outputs, and metadata.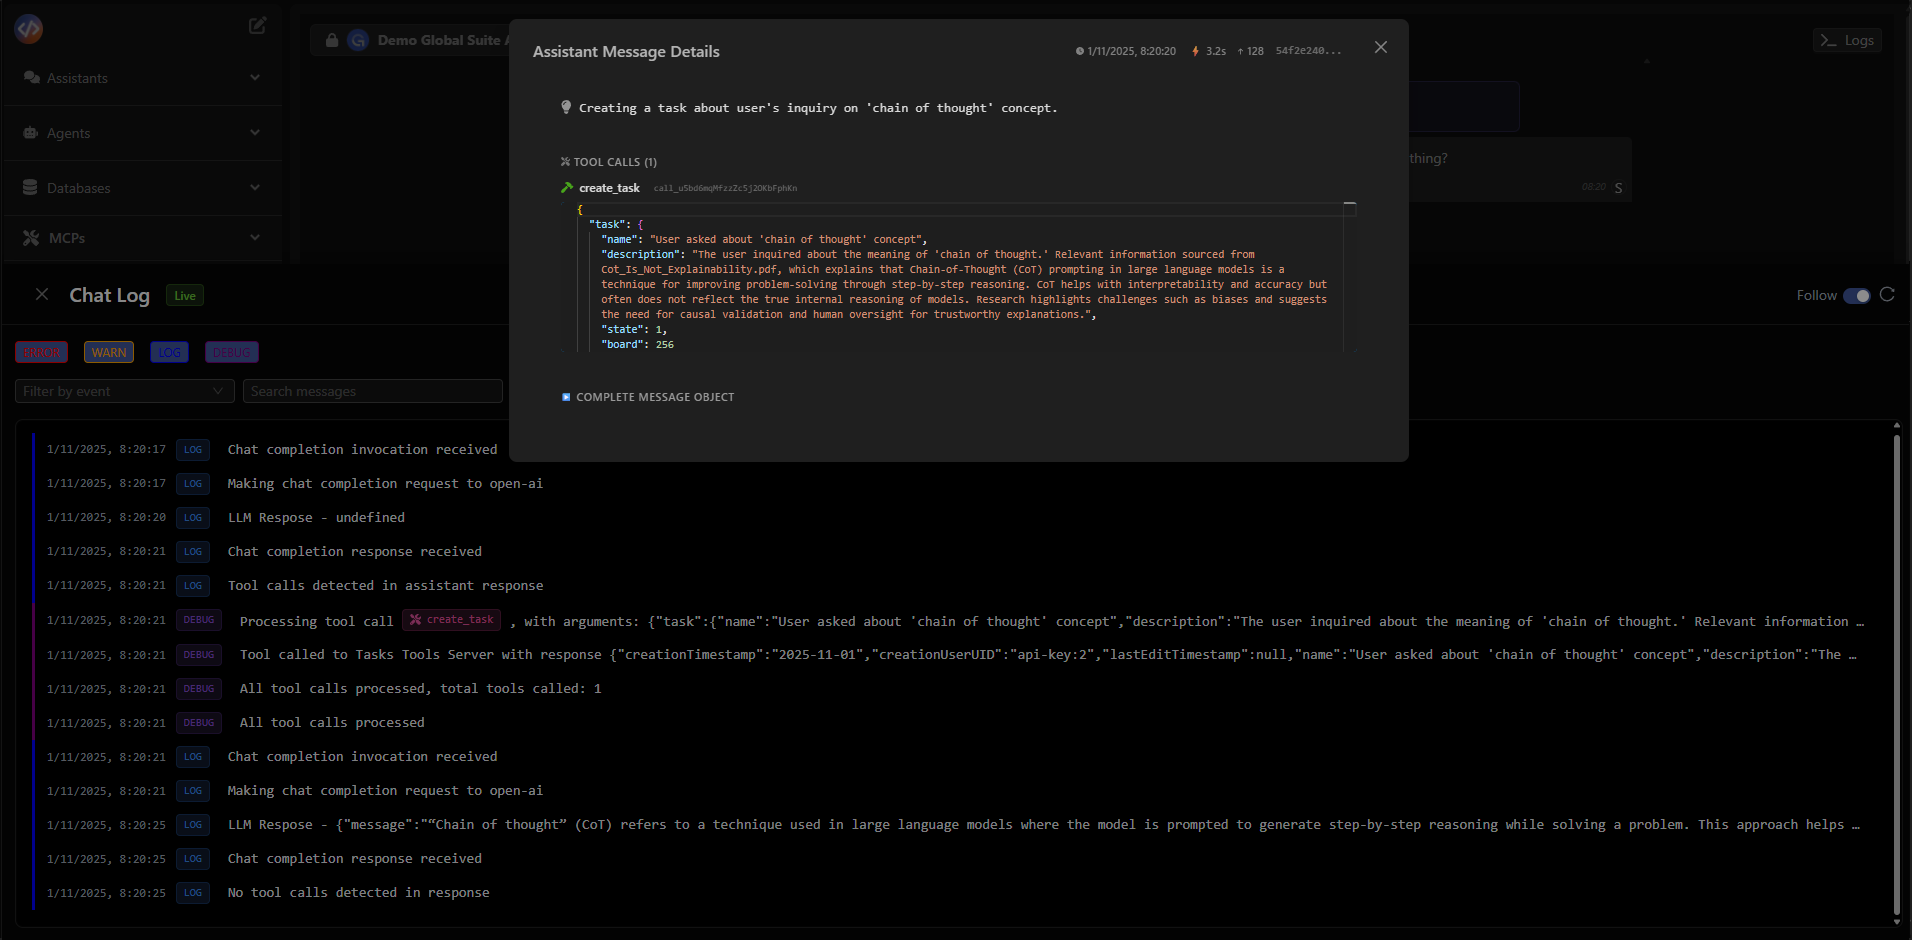
- Processes the received context.
- Decides which tool to use.
- Generates the final response shown in the conversation.
Troubleshooting Best Practices
- Review the Logs after every test to identify possible errors in tool calls or MCP configurations.
- Validate the arguments sent to each tool before deploying to production.
- Use short and direct conversations during initial tests.
- Evaluate performance: monitor response times and token usage in each execution
Next Steps
Other Options
Explore advanced configurations such as contextual settings, memory, or specialized behaviors.
API Execution
Discover how to launch and manage interactions with your assistants directly through Devic’s public API.