> ## Documentation Index
> Fetch the complete documentation index at: https://docs.devic.ai/llms.txt
> Use this file to discover all available pages before exploring further.
# Logs
> Analyze and debug your agents’ executions through Devic’s technical logs and event timeline.
# Log Analysis and Execution Traceability
Devic incorporates a complete **logging and traceability** system that allows you to inspect the internal behavior of agents during each execution.\
Through the logs, you can follow step by step the actions performed, the tools used, the messages exchanged with the model, and the state of each task.
This module facilitates **debugging, auditing, and continuous optimization** of agent performance, providing full visibility into every process.
***
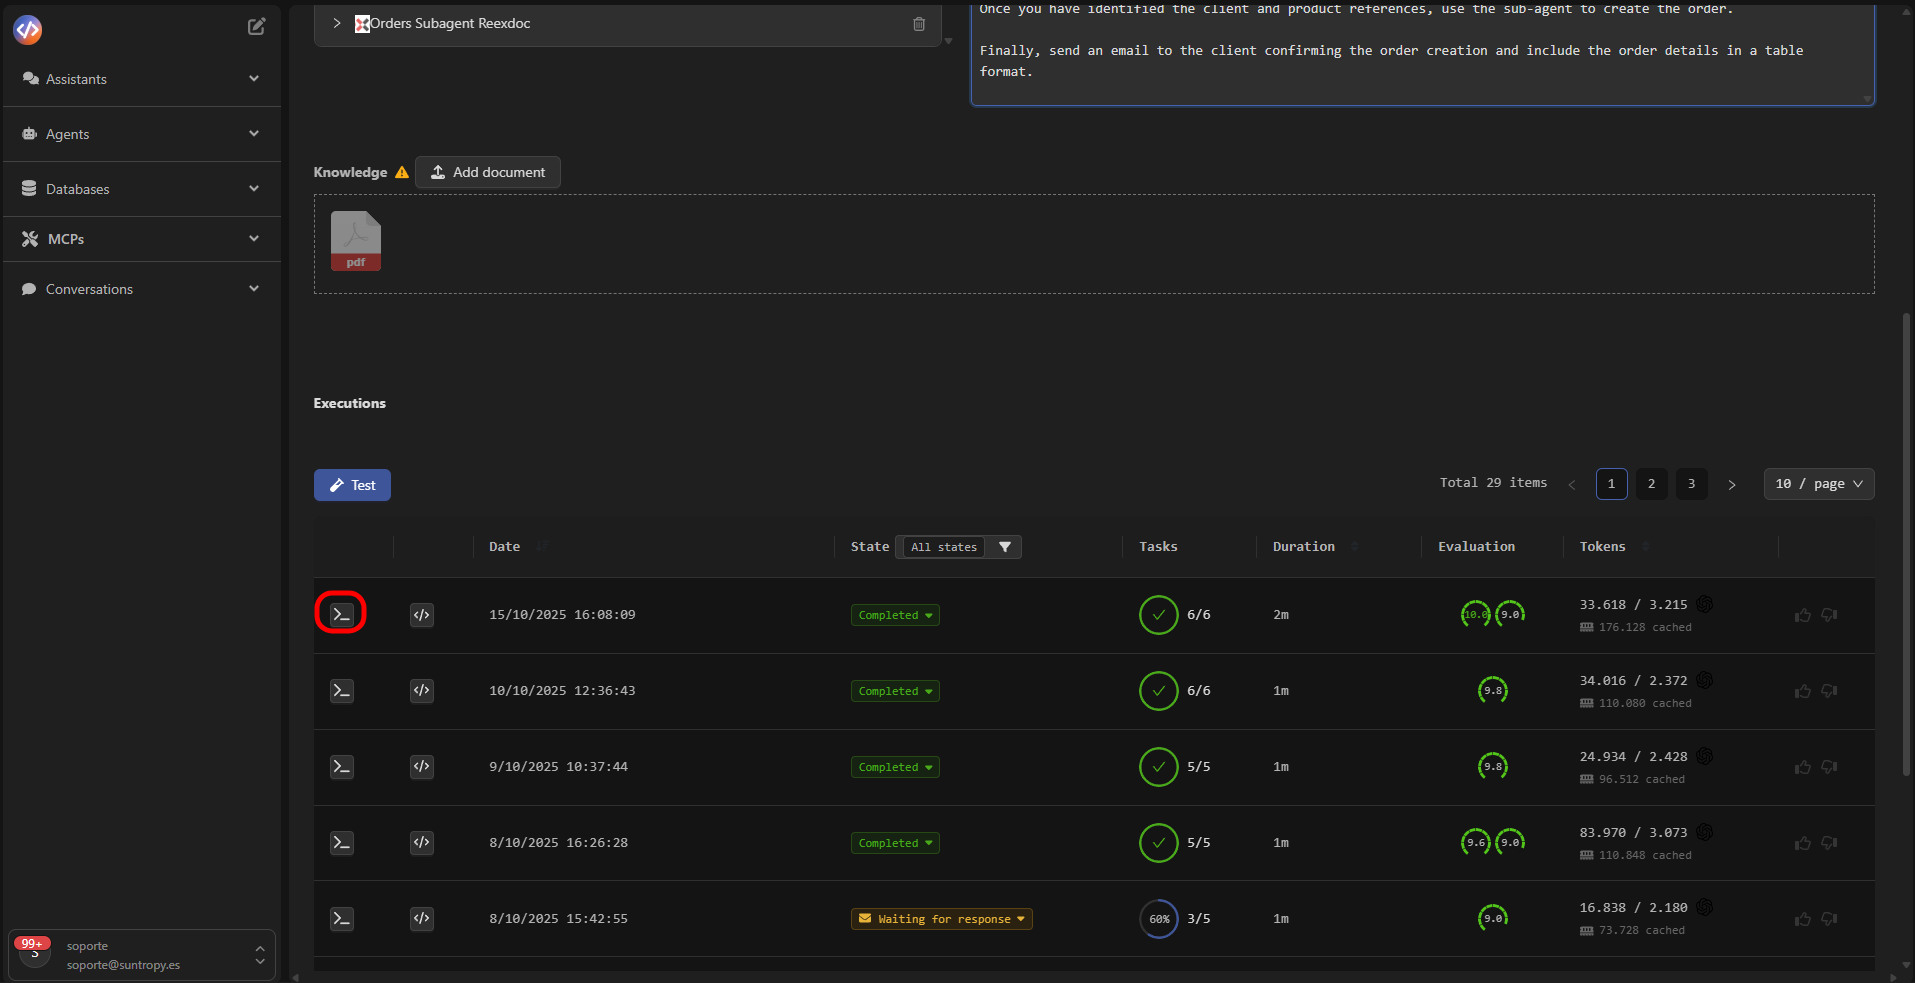
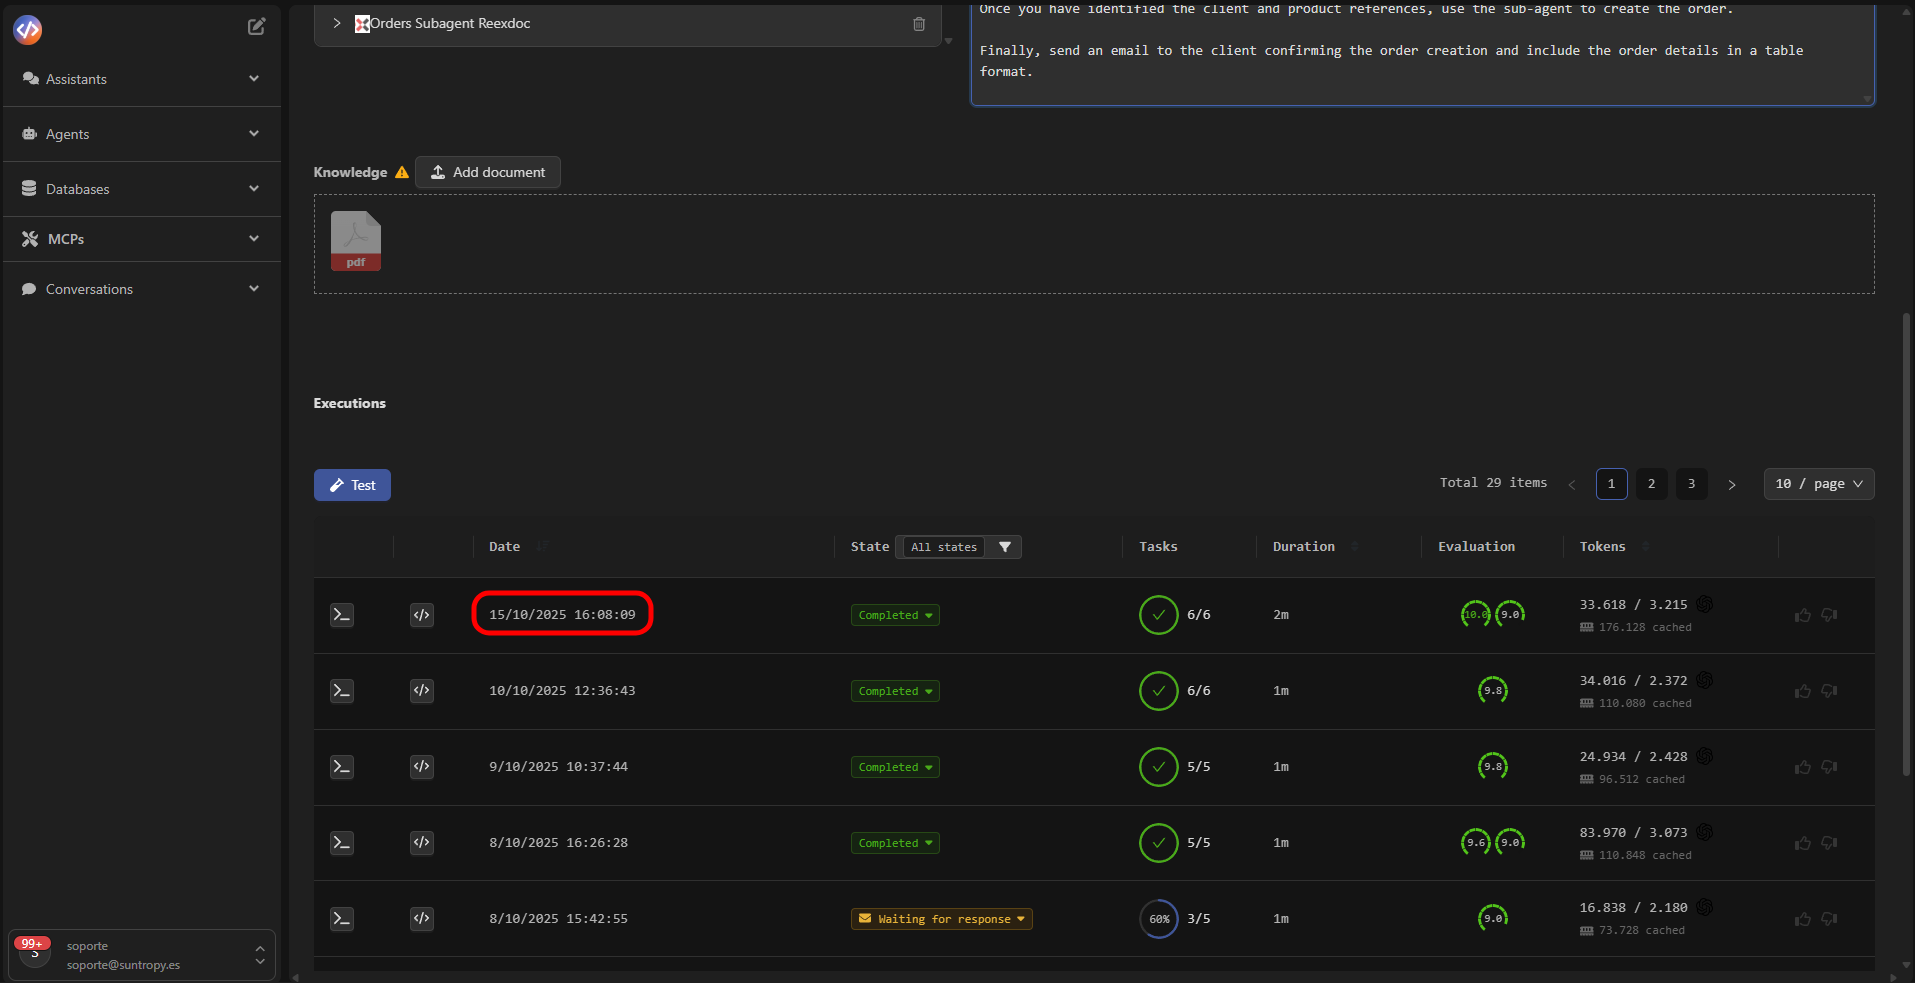
## Accessing Logs
From the agent’s execution history, each entry includes options to **inspect its technical log**.\
When selected, the **Thread Log** panel opens, showing in real time all events generated during the execution.
 ##
##
 The logs panel is divided into three information levels:
| Level | Description |
| ---------------- | ------------------------------------------------------------------------------- |
| **LOG / INFO** | Informational messages about the execution process. |
| **DEBUG** | Low-level details about tool calls, internal steps, and intermediate variables. |
| **WARN / ERROR** | Incidents or errors detected during the process. |
***
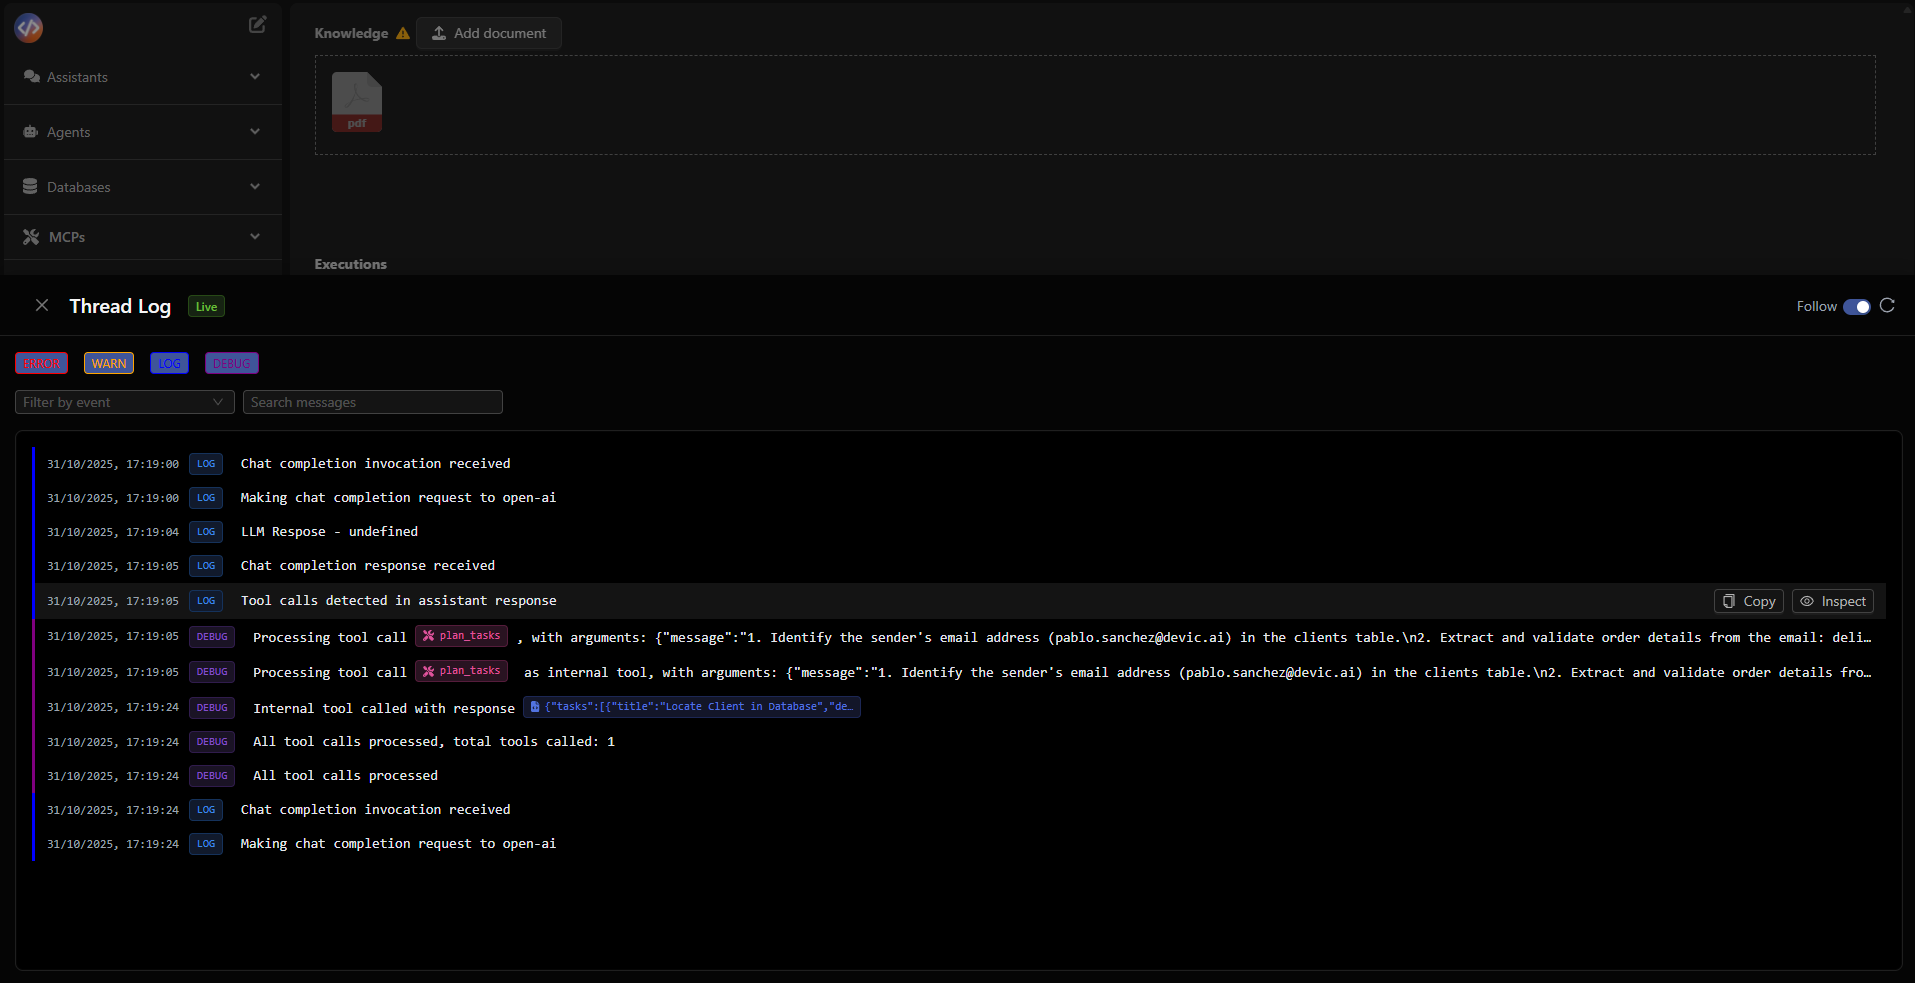
## Thread Log
The **Thread Log** records in a structured way the technical conversation between the agent, the tools, and the model.\
Each event is documented with its type, execution timestamp, and content.
The logs panel is divided into three information levels:
| Level | Description |
| ---------------- | ------------------------------------------------------------------------------- |
| **LOG / INFO** | Informational messages about the execution process. |
| **DEBUG** | Low-level details about tool calls, internal steps, and intermediate variables. |
| **WARN / ERROR** | Incidents or errors detected during the process. |
***
## Thread Log
The **Thread Log** records in a structured way the technical conversation between the agent, the tools, and the model.\
Each event is documented with its type, execution timestamp, and content.
 ##
##
 Among the available information:
* **Tool calls** and the arguments used.
* **Model responses (LLM Response)**.
* **Internal system messages** (start, planning, completion).
* **Task states** and completed steps.
***
## Message Details
Selecting a specific event opens the **Assistant Message Details** panel, where the tools called by the agent are displayed, along with their payload and the generated response.
Among the available information:
* **Tool calls** and the arguments used.
* **Model responses (LLM Response)**.
* **Internal system messages** (start, planning, completion).
* **Task states** and completed steps.
***
## Message Details
Selecting a specific event opens the **Assistant Message Details** panel, where the tools called by the agent are displayed, along with their payload and the generated response.
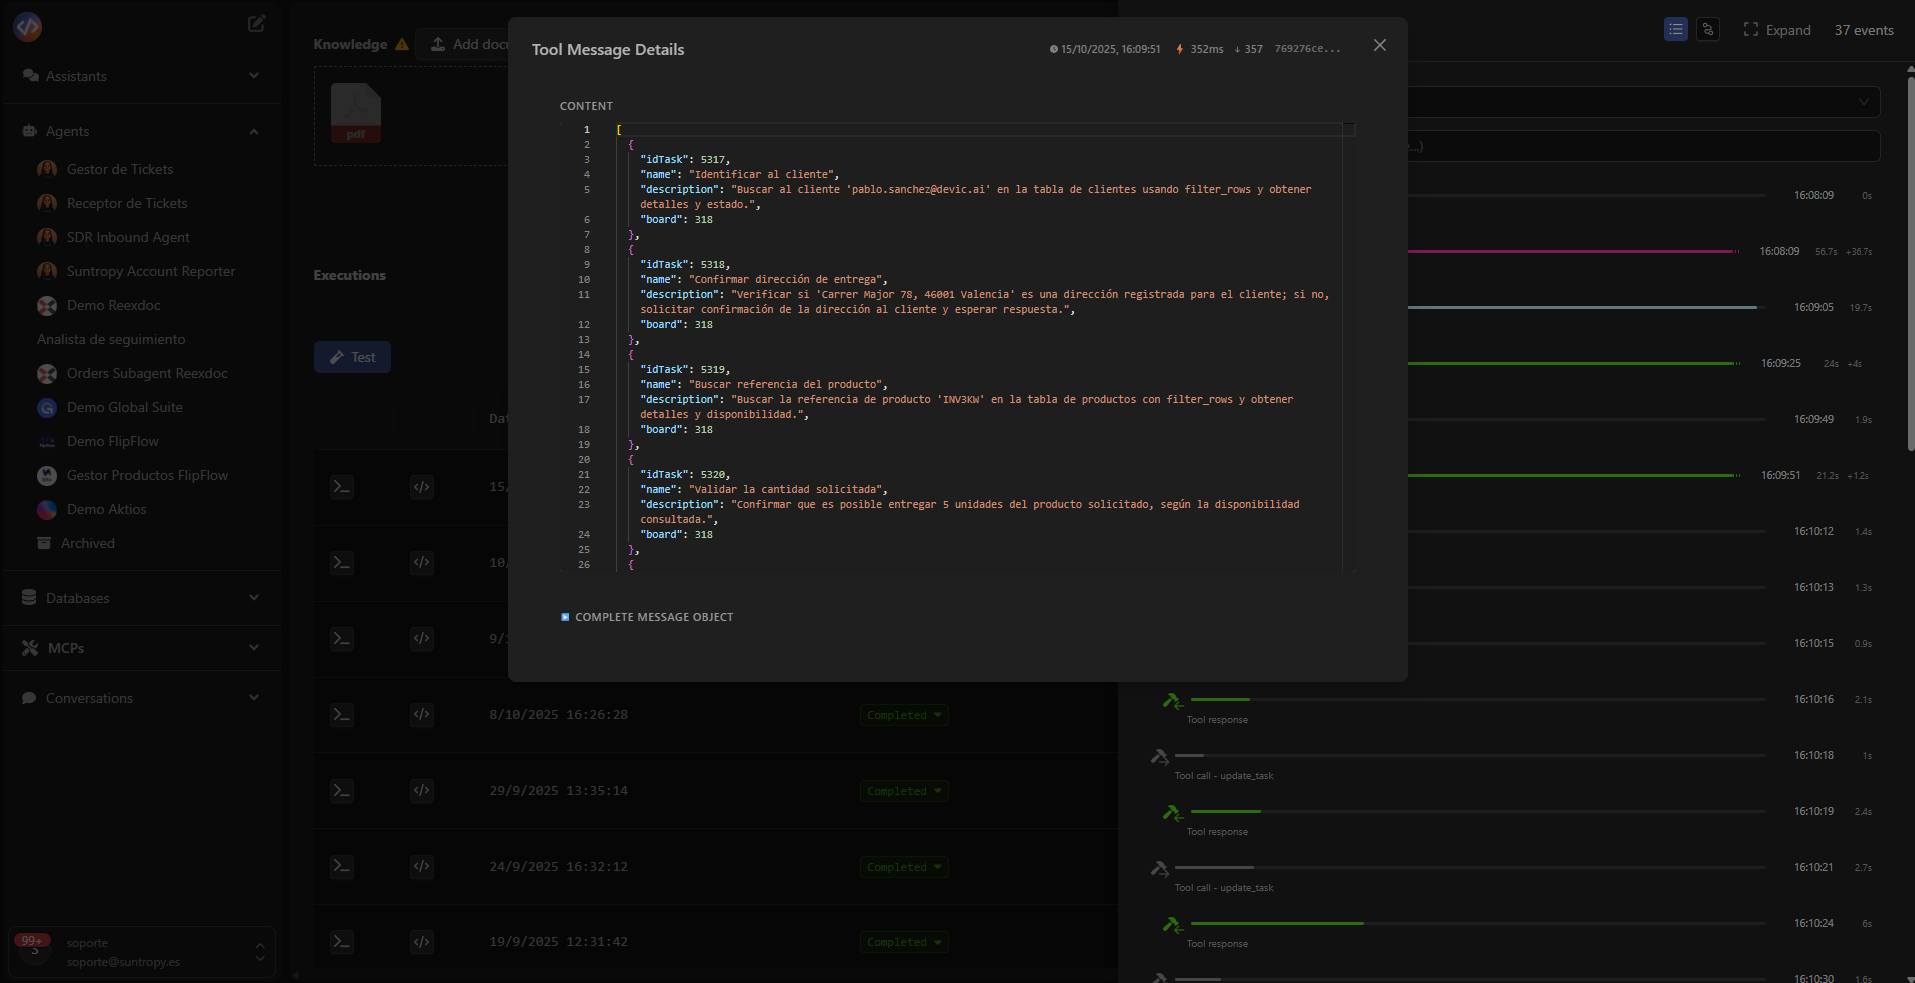 This view allows you to precisely verify which instruction the agent executed, what data it processed, and how each tool responded.\
It is especially useful for **auditing complex workflows or debugging unexpected behaviors**.
***
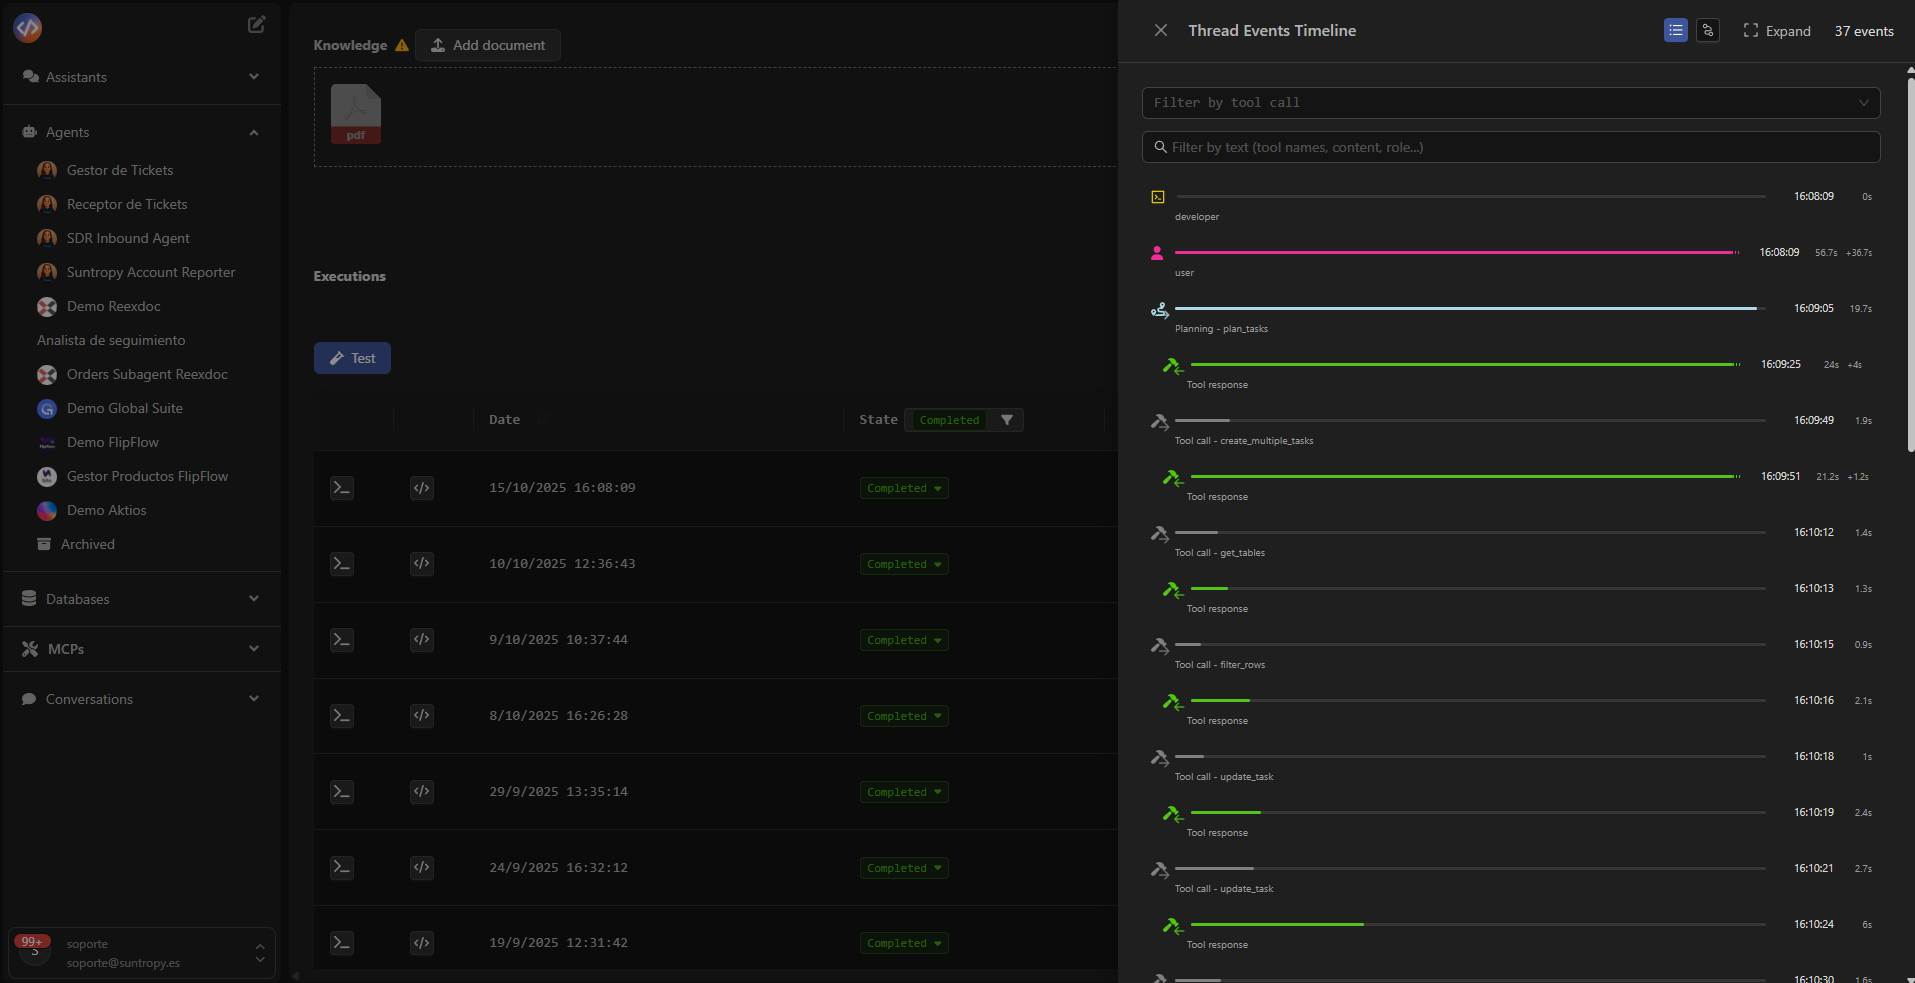
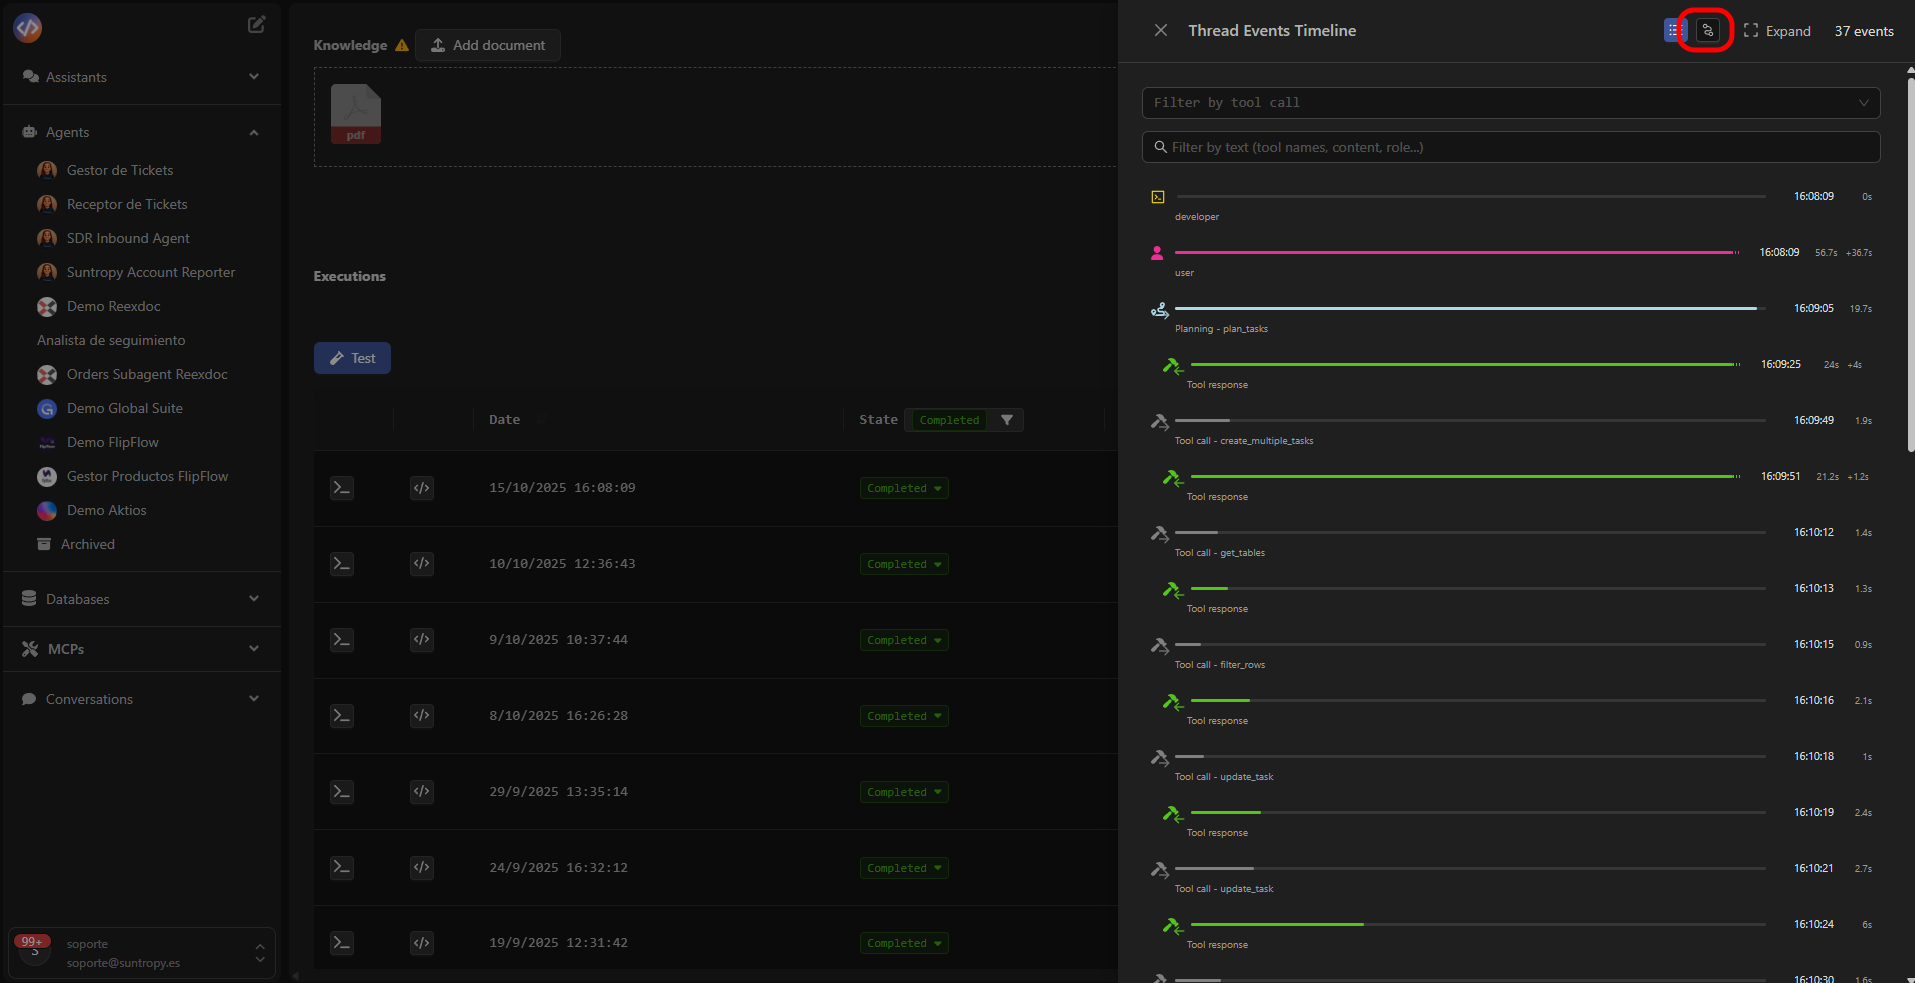
## Event Timeline
The **Thread Events Timeline** offers a visual and sequential representation of the agent’s entire execution, showing how user actions, the model, and tools interact.
This view allows you to precisely verify which instruction the agent executed, what data it processed, and how each tool responded.\
It is especially useful for **auditing complex workflows or debugging unexpected behaviors**.
***
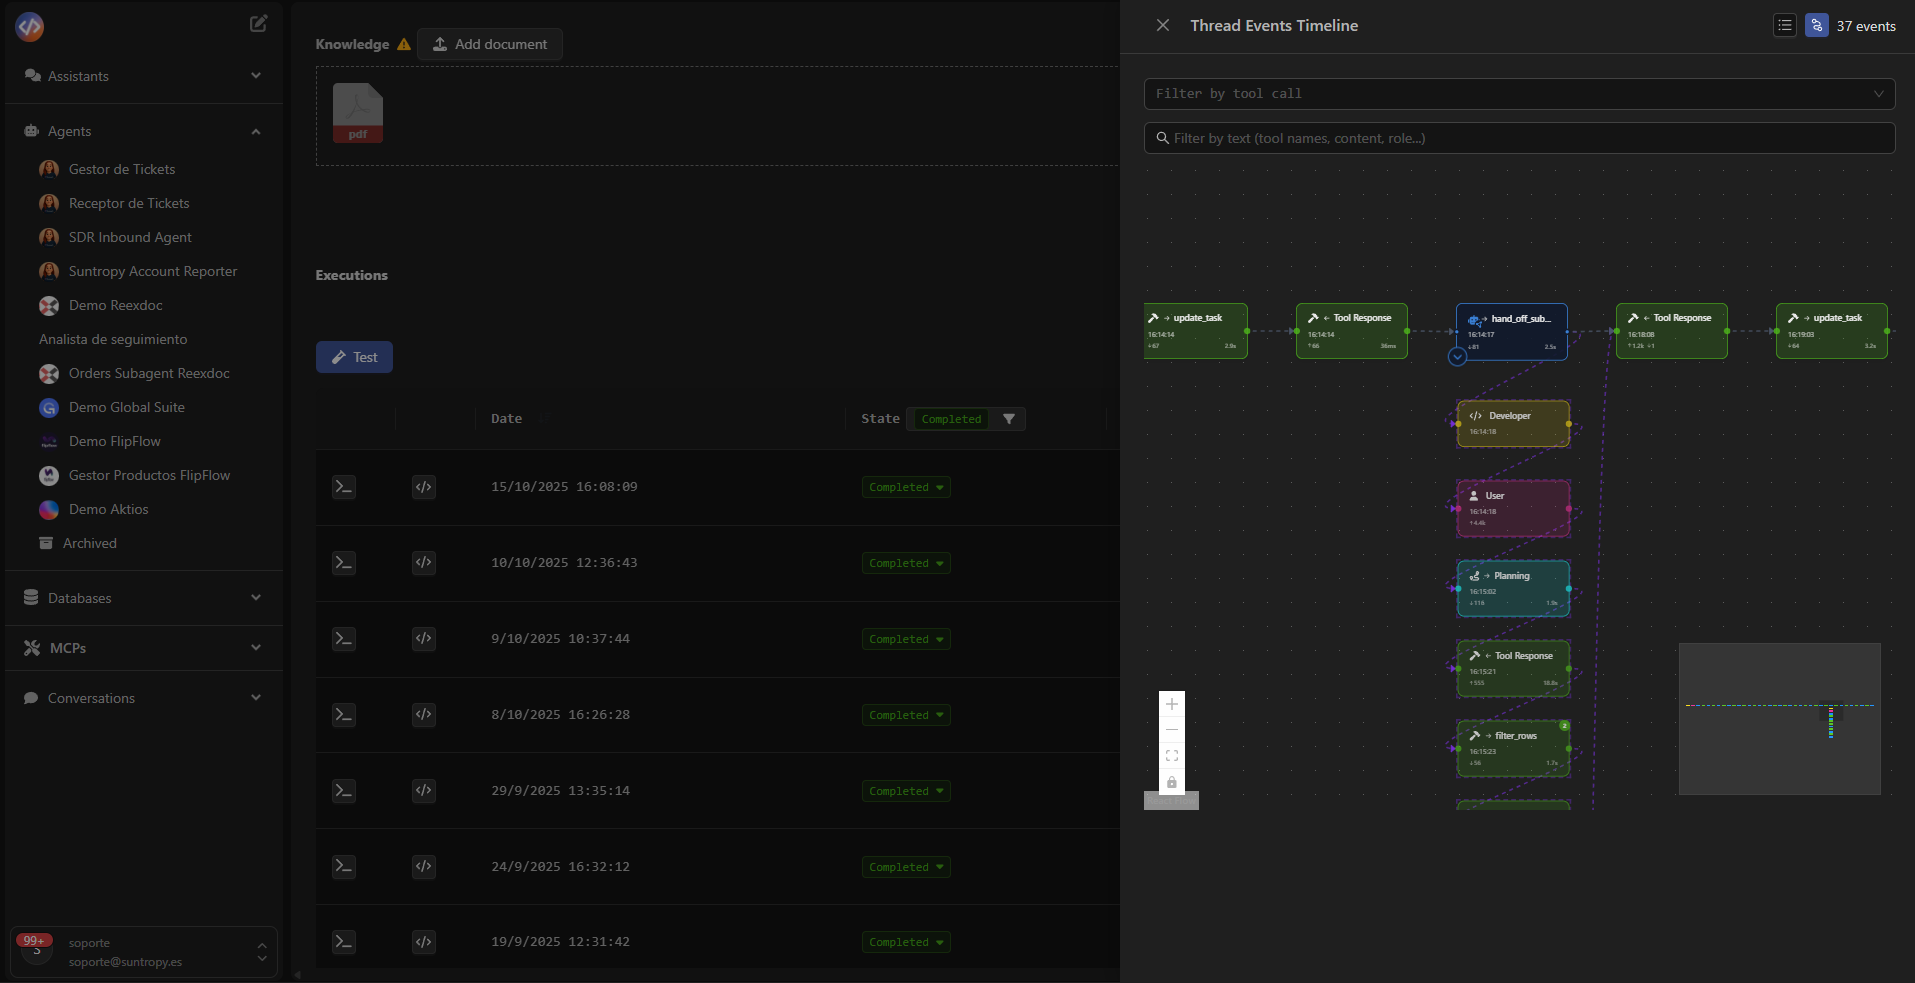
## Event Timeline
The **Thread Events Timeline** offers a visual and sequential representation of the agent’s entire execution, showing how user actions, the model, and tools interact.
 ##
##
 Each block in the timeline represents a step in the workflow:
| Element | Description |
| -------------------- | ------------------------------------------------------------------- |
| **User** | Initial message or instruction sent to the agent. |
| **Planning** | Internal planning stage before executing actions. |
| **Tool Call** | Execution of a tool (e.g., RAG query, task update, PDF generation). |
| **Tool Response** | Result returned by the tool. |
| **Finish Execution** | Closing stage where the agent completes the task. |
***
## Export and External Analysis
Logs can be **exported** for analysis in external tools or integrated into corporate auditing and observability systems.\
This ensures **complete traceability** of the agents and reinforces operational control in production environments.
***
Devic’s logging system not only provides technical visibility but also serves as an essential tool for continuous improvement and validation of agent behavior.
***
## Next Steps
Discover how to integrate human validation into your agents’ flow to approve, correct, or enrich decisions before final execution.
Manage tasks generated by the agents, monitor their status, and control their progress within each execution.
Configure metrics and automatic evaluations to measure the performance, accuracy, and consistency of your agents.
Monitor token consumption, analyze execution costs, and optimize the use of models and resources.
Each block in the timeline represents a step in the workflow:
| Element | Description |
| -------------------- | ------------------------------------------------------------------- |
| **User** | Initial message or instruction sent to the agent. |
| **Planning** | Internal planning stage before executing actions. |
| **Tool Call** | Execution of a tool (e.g., RAG query, task update, PDF generation). |
| **Tool Response** | Result returned by the tool. |
| **Finish Execution** | Closing stage where the agent completes the task. |
***
## Export and External Analysis
Logs can be **exported** for analysis in external tools or integrated into corporate auditing and observability systems.\
This ensures **complete traceability** of the agents and reinforces operational control in production environments.
***
Devic’s logging system not only provides technical visibility but also serves as an essential tool for continuous improvement and validation of agent behavior.
***
## Next Steps
Discover how to integrate human validation into your agents’ flow to approve, correct, or enrich decisions before final execution.
Manage tasks generated by the agents, monitor their status, and control their progress within each execution.
Configure metrics and automatic evaluations to measure the performance, accuracy, and consistency of your agents.
Monitor token consumption, analyze execution costs, and optimize the use of models and resources.